

Very detailed article here: https://www.reaktor.com/articles/why-ive-tracked-every-single-piece-of-clothing-ive-worn-for-three-years
Impressive data collection!
However, it is really hard to compare the wear of my own clothes with these findings because of the fundamentally different approach to clothing.
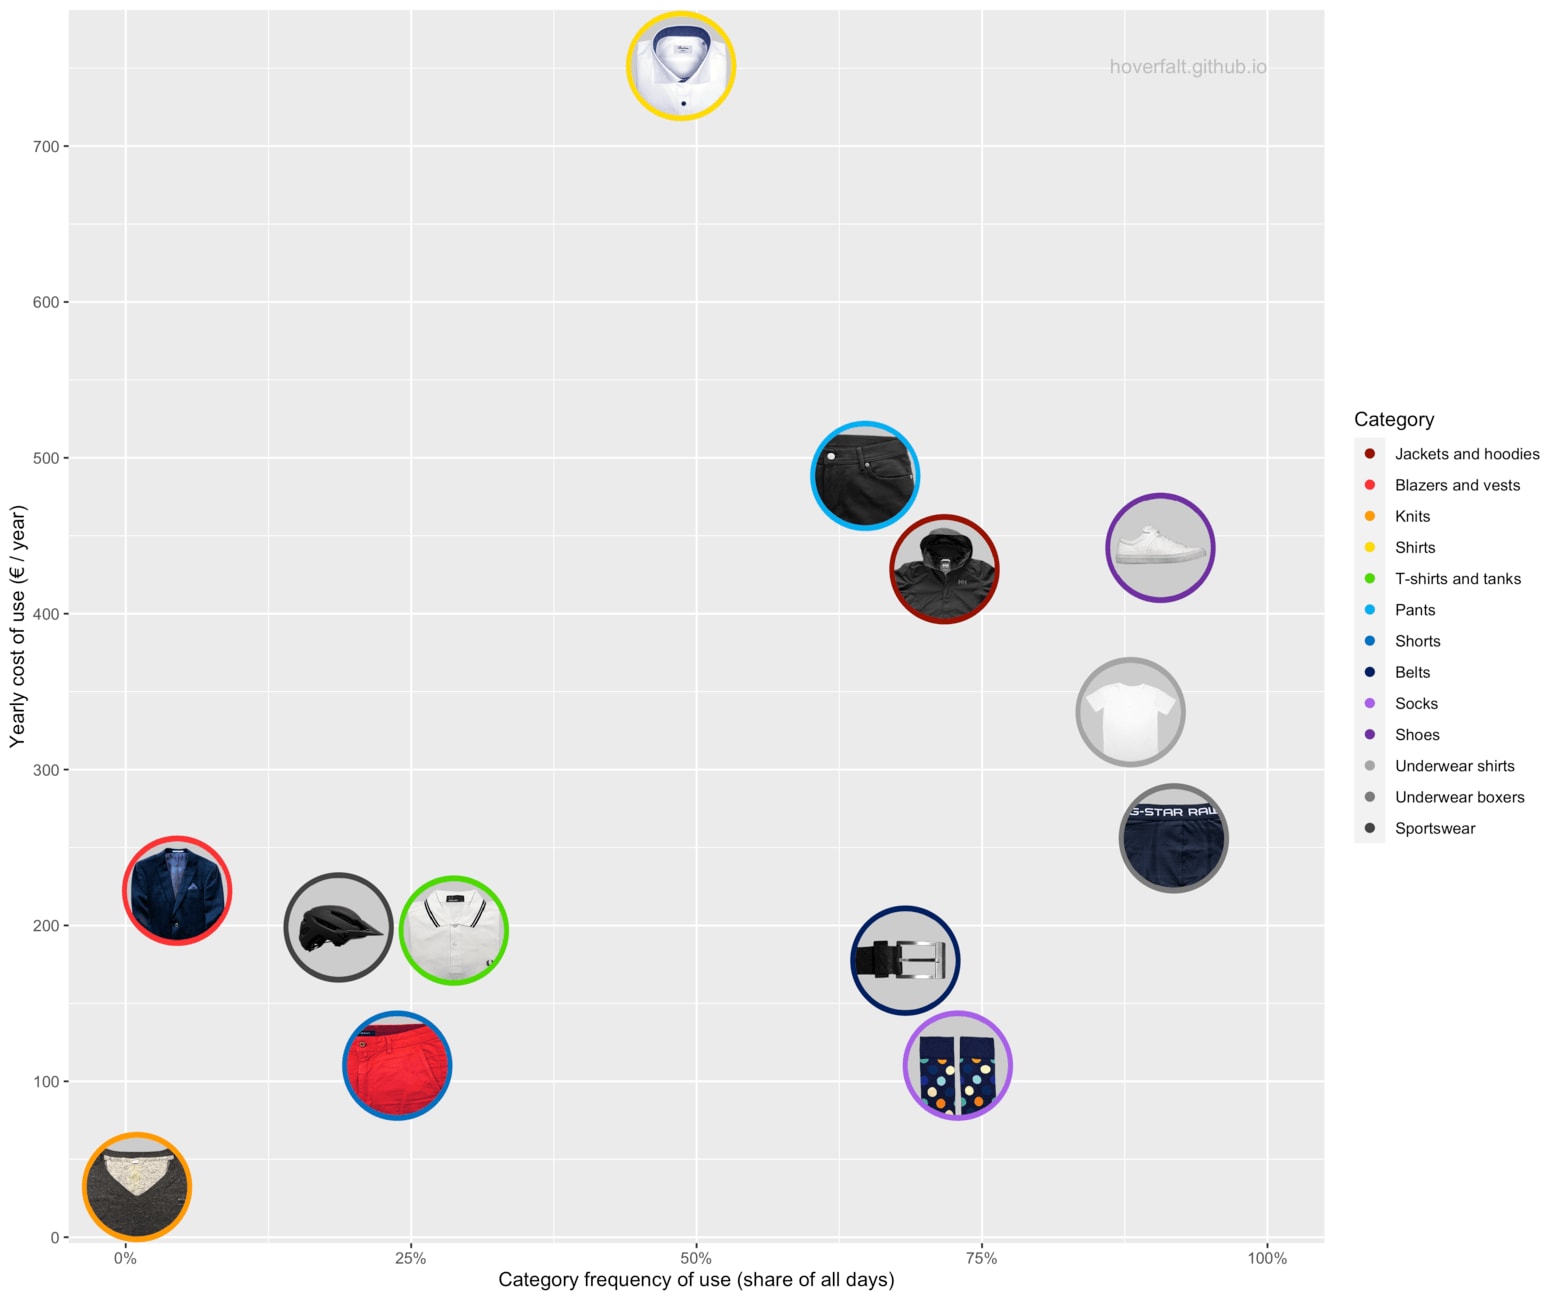
Underwear shirts typically last between 20 and 25 times. That means an active shirt with about 28 wears is likely to be nearing the end of its lifecycle
What? I wear my shirts for years and I don’t have that many of them either. Sure, they get holes at some point but that isn’t a reason for me not to wear them. My point is, the wear expectancy is substantially different if one throws out clothes after 20 wears or if one keeps using them until they fall apart.
Not sure if OP is the author, but these R graphs are really bland. Looks like ggplot2, so why not use a package like ggthemes? Or at least remove the atrocious grey background (personal opinion)?
I am definitely not the author!
I can’t imagine that 3 years of data is even remotely enough for this. I have articles of clothing that are decades old (3+ decades old), but I have never bought any piece of clothing expecting it to last that long, and the clothing that lasts isn’t always the type that I’d expect. At best, 3 years is enough for a “snapshot” of the life of most clothing, I would think.
Then again, I’ve owned the same car for the last 21 years, so maybe I am not a typical consumer.